GeoNotes Cypress Hills and area
THE BIG THAW OF 17,000 YEARS AGO
the nature of glacial dynamics, and our changing climate
 By Visit Greenland from Nuuk, Greenland - Blue ice in South Greenland, CC BY 2.0, https://commons.wikimedia.org/w/index.php?curid=30613876
Virtually all the landscapes in SW Saskatchewan and SE Alberta are post-glacial, originating from the last glacial cycle, which peaked around 20,000 years ago. This peak is known as the Last Glacial Maximum (LGM). The continental glacier stopped 150-200 km across the international border in northern Montana, leaving Canada almost completely covered in ice. Around 18,000 years before the present (BP), the planet began its warming trend, and the continental glacier slowly began to melt as the deglaciation process moved northeastward. The ice front's initial rate of retreat was 60 m/year and 275 m/year in the final stages, with an average retreat of 150 m/year.
South of the Cypress Hills, deglaciation began early around 20,000-18,000 BP with the formation of a 341 km long Frenchman River channel with its headwaters at Cypress Lake. By 17,000 BP, glacial melting deposited unsorted angular glacial debris (till) into various types of morainal deposits (glacial landforms) up to 30 m thick in some areas, along with other minor glacial landforms such as the drumlins near Dollard, SK. The meltwater streams on the ice sheet and ground reworked some of this angular debris into more rounded pebbles, cobbles, and boulders. Some of the well-rounded clasts in the glacial debris are reworked gravel from preglacial river channels, and the conglomerate from the Cypress Hills Formation.
The meltwaters also washed out the sand, silt, and clay materials and deposited them in outwash plains and glacial lacustrine (glacial sediment) lakes. Glacial meltwaters carved the landscape into deep valleys and broad channels, some of which, today, are occupied by small "underfit" streams and rivers. An underfit stream or river is too small to have created the valley in which it is situated. Some examples are the Battle Creek and Frenchman River valleys, and the Gap separating the Center Block from the West Block of the Cypress Hills.
The meltwater channels south of the Cypress Hills are much larger than those north of the hills. This has led some researchers to conclude that there was more glacial meltwater activity to the south and that much of the ice in the area had melted before the ice front began to retreat.
Occasionally, very large boulders (glacial erratics) can be seen in the debris mix. Less rounded and more angular boulders saw less glaciofluvial (glacial water) rounding to their surfaces. Aeolian or eolian (pronounced eh-oh-ly-an) or wind deposits are also present and are deposited as fine silt (loess) on the Cypress Hills West Block plateau, and as sand dunes in proglacial outwash plains. Proglacial simply means in front of, at, or immediately beyond the margin of a glacier.
Much of the sand and finer materials in the debris mix came from the abrasion or grinding of rocks at the base and within the dynamics of glacial movement. This process also creates rounded edges on the glacial debris clasts, which are further rounded by fluvial activity.
The more erosion-resistant erratics and boulders from the Canadian Shield give a false impression that most of the material came from the shield; however, only some of the debris came from there. The rest came from preglacial terrains as the ice sheet slowly moved southward beyond the Shield. The basal till is generally regarded as consisting of local debris reflecting its local bedrock source. During deglaciation, distantly transported debris can also get mixed in with locally derived till.
When the continental glacier (Laurentide) of the last glacial cycle (Wisconsin) began to advance approximately 115,000-100,000 years ago, it flowed over remnants of ancient worn-down mountain belts older than 543 million years (Precambrian) from northern Saskatchewan and northern Canada's shield region. As the glacier moved southward, the freeze-thaw weathering process plucked and quarried out rocks from the exposed rocky surface (outcrop), making up the various igneous and metamorphic rock formations of the Canadian Shield. These ancient mountain ranges were created much in the same way the Rockies and other mountain ranges were and are created when two tectonic crustal plates collide, resulting in a crinkling effect creating the mountains. This crinkling generates extreme pressures and temperatures that transformed the igneous and sedimentary rocks into metamorphic rocks. Along with the eroding mountain belts, erosion of the Canadian Shield also exposed subsurface intrusive igneous plutons comprising mostly of granitic and granitoid mineral compositions. Most of the boulders and erratics seen in the area of the Cypress Hills came from metamorphosed sedimentary rocks, and to a lesser extent, metamorphosed igneous and igneous plutonic rocks that were once part of the Canadian Shield. Some rocks, for example, the creamy-white claystone, are regionally or locally derived from subcrop (unexposed) rock formations.
Glaciers and ice sheets look very rigid and are brittle, creating crevasses on the surface as the ice moves, but deeper down, due to the immense weight, the glacial ice becomes semi-plastic. The basal plasticity of the ice makes it flow very slowly with an occasional surge over the land surface as it incorporates the loose surface material into the glacier. The bulk of this material is carried within and at the base of the glacier, similar to that of a dump truck, only to be dropped later during a time of ablation (melting).
The Laurentide Glacier began with at least three cold cells (1,2, and 3 in Fig. 1) in northern Canada, forming three distinct regional ice sheets that eventually joined into one large glacier. Glaciers tend to create their own environment, and over many tens of thousands of years, when snow accumulation exceeds ablation, continental glaciers like the Laurentide can get very thick, growing upwards to more than 3 km in the northern regions. Prior to glaciation, there was an overall average temperature drop of 4 degrees Celsius, which continued until the warming trend began around 20,000 years ago.

The regional ice sheets grow and move by extending lobes that move independently of each other. The lobes surge forward, moving faster than the main ice sheet, and are aided by water at the base acting as a lubricant. These lobes eventually meet, adding to a growing glacial mass that can eventually cover an entire continent.
Glacial retreats or advances are not linear and more like a two or three-step forward and backward dance, readvancing and retreating several times in an area with an overall trend either to advance or to retreat. The tree line, which includes tundra, sub-tundra vegetation, and the Boreal forest, is also very sensitive and fluctuates with glacial movements. Between 20,000-12,500 BP, the Cypress Hills and area experienced five glacial retreats and readvances, each distinguished by their morainal deposits. This process can create complex glacial terrains, making it a challenge to unravel glacial and paleoclimate events.
During the last glacial maximum, the Laurentide glacier in SE Alberta and SW Saskatchewan reached a maximum thickness of 1 km, with the ice thickness decreasing southward. Ice lobes flowed around the Cypress Hills and through the Gap, leaving the top 95-100 m unglaciated, exposing the landmass as three distinct nunataks, today known as blocks. The West Block nunatak is the largest and comprises an area of 300 sq km. It is separated from the Central Block by morainal deposits and glacial meltwater channels known as the Gap. Today, the West Block reaches a peak of 1467 m at the Head of the Mountain in Alberta, the highest peak between Labrador and the Rocky Mountains.
The three unglaciated blocks, locally called benches, of the Cypress Hills are the West, Center, and East Block. They are remnant erosional plateaus with preglacial V-shaped fluvial (water) valleys going back to Late Tertiary (11.6-2.6 million years) and were formed under arid to semi-arid climate conditions. Interestingly, the oldest glacial deposits on the plateau not touched by the Wisconsin glacial cycle consist of scattered glacial material and erratics derived from northern Canada that are possibly older than 200,000 years, much older than Wisconsin, or even the Illinoian glaciations (see Figure 2 time scale).
Cryogenic (deep freezing) effects of the glacial climate on soils are noticeable on the West Block nunatak, including solifluction (movement of wet soil down an already frozen slope), frost wedges, and freeze-thaw movement of pebbles. It should be noted that when researching this article, the more recent information showed three distinct unglaciated sections in the Cypress Hills; however, the extent of glaciation on the East and Center blocks is somewhat ambiguous.
Glacial scientists using Greenland and Antarctic ice core samples can go back approximately six million years to obtain paleoclimate data. The ice core record is continuous for the first 800,000 years, becoming intermittent after that. The first 800,000 years of ice core samples accurately define changing climates by measuring variable concentrations of atmospheric gases trapped in air bubbles found in the ice core sequences. Dust, ash, and pollen in the core sequences are also important paleoenvironmental indicators. The data plotted in Figure 2 strongly suggest that natural CO2 is an excellent indicator for identifying the beginning and the end of glacial and interglacial cycles of the past 2.5 million years. The sudden rise of CO2 today (time 0) in Figure 2 may not be natural and could be a result of statistical and chart construction exaggeration of climate modelling based on anthropogenic effects, which may not reflect our current natural CO2 increases over time. It should be noted that the observations at the CO2 monitoring stations at Mauna Loa, Hawaii, Canada, and around the world do show a slow rise in CO2 concentration over time; however, according to some climatologists, there is very little or no indication that there is an increase in temperature from the additional CO2 released into the atmosphere. Studies also show a CO2 increase beginning with the Industrial Revolution in the mid-18th century. Antarctic ice core samples strongly indicate that when the planet warms, a rise in natural CO2 concentration follows as the oceans, the world's largest carbon sinks, warm up. The opposite is true when the planet cools. The release of natural CO2 from the oceans due to their warming may be the main source of CO2, and the manmade CO2 contribution may be minimal.
There is disagreement and confusion in the scientific literature and among the public as to the CO2-temperature relationship and how much CO2 is actually anthropogenic. The disagreements and confusions are fuelled by Dr. Michael Mann's 'hockey stick' chart, which was constructed using questionable and corrupted (whether deliberate or not) scientific data in the late 1990's. The sudden rise of CO2 with temperature portrayed in Mann's chart in the latter part of the 20th and early 21st centuries was used by Al Gore to sell the anthropogenic global warming scheme. The chart, unfortuately has become the basis used by climate activists to promote their climate policies and agendas. Another conflict is over the heat source that drives the current CO2 levels and global warming temperatures, and the same would obviously be true for global cooling and lower CO2 levels. The large and small climate cycles and events (including El Niño and La Niña) are complex, and their relationships are not straightforward.

The glacial maximum cycles over the past 650,000 years are rhythmically occurring approximately every 100,000 years, with an interglacial period lasting between 10,000 to 30,000 years. According to glacial experts, the data in Figure 2 suggests the ice age cycle may not be over yet, and that we are currently living at the peak of a natural CO2 cycle in an interglacial period (Holocene Interglacial) within an overall larger glacial cycle (the Laurentide glacial period) which began approximately 2.6 million years ago, the beginning of the Quaternary period. Within the Quaternary is the latest epoch, the Holocene epoch, which began at the end of the last ice age. The generally accepted beginning of the Holocene varies with locality and is between 12,000-8,000 BP.
Figure 2 reveals more striking information. Over the past 650,000 years, we have had at least 7 major ice ages (blue) and interglacial (red) periods along with smaller glacial advances and retreats, and many minor warming and cooling periods. The warming trend and deglaciation that began 18,000 years ago may well be continuing today as seen by the overall melting of ice fields in Greenland, Northern Canada, and the localized melting of the extensive Saint Elias alpine glaciers which cover the Saint Elias Mountains in northern B.C., Yukon, and Alaska. These ice fields may be remnants of ice from the Cordilleran Ice Sheet and the Wisconsin glacial cycle (Fig. 1), melting and contributing to the rising ocean levels. The earth's climates vary greatly, and in the higher alpine elevations and to some extent in colder continental environments (e.g., Antarctic) some areas of the world may experience glaciers retreating or disappearing while other areas may see glaciers forming or advancing. Slight average temperature fluctuations trending hot or cold are most noticeable in higher elevations, including the Cypress Hills, colder climates, and the coldest part of the day, just before sunrise. For instance, my parents owned a ranch in the Cypress Hills on the south side near the summit of the East Block. From 1976-1996, a small fractional rise in temperature was enough to send farmers seeding three to four weeks earlier and extend their fall harvesting by an additional month. The overall summer temperatures and moisture in the hills remained the same as before the warming trend; however, the winter temperatures were generally warmer with less winter snowfall. According to some climatologists, the temperature rise tapered off until the mid-2000s, when the average warming trend continued upward.
What initiates and terminates ice ages and large and small-scale climate cycles is not well understood. There are many competing theories, ideas, and questionable predictive models, some of which are wrapped in political agendas (e.g. Climategate) that are used as the basis for drafting extremely profitable climate policies (e.g. carbon taxes). Still, others believe the 'climate change' and 'climate crisis' cliches are a cover for more sinister large-scale military-style weather manipulations used in weather wars by state and possibly non-state actors within the military-industrial complex. When experiencing an extreme, record-breaking weather event, a question comes to mind: Can the Earth's current natural weather dynamics produce such an event, or has it been artificially assisted?
Climate disruptions may be caused by a single event or several events working together. Cosmological, planetary, and anthropogenic (man-made) factors have been attributed to climate change. Increasingly, more scientists are beginning to suspect that small and large climate variations are driven by activities from within the sun that can affect the solar radiation output. This somewhat minimizes the effects of the traditionally accepted Milankovitch cycles, which were named after Serbian geophysicist/astronomer Milutin Milankovic. These cycles were a theory that remained unproven until 1976, when it was discovered that the cycles played some part in the pacing of the Pleistocene glacial cycles, but their role in glacial inception and deglaciation remained unclear.
However, a recent study by Barker, et al (2025) argues against the solar insolation cycles, saying that despite decades of research, its effects on glacial cycles still remain unknown. The researchers, instead, focused on the morphology of deglaciation-glacial inception and compared that with Earth's orbital phasing. They looked at natural climate cycles over the past million years in the Northern Hemisphere and found a correlation with small cyclical variations in Earth's orbital eccentricity around the sun, axial tilt, and precession (wobble) and the timing of climate changes between ice ages and interglacial periods. They found these periods strongly correlate with the phasing of precession vs obliquity. According to Barker's research, precession has more influence on deglacial onset, and obliquity appears more important for reaching peak interglacial conditions and glacial inception. The researchers feel confident they have a predictive model that can predict the onset of the next ice age in 10,000 years.
The Milankovitch cycles have long been associated with the possible causes of major planetary climate disruptions, such as ice ages. However, in recent years, some climate scientists have argued that the cyclical variations are not great enough to produce the extreme climate effects that the Earth has experienced in the past. These cycles include Earth’s orbital eccentricity around the sun (deviation of Earth orbit from circularity, 100,000-year cycles), obliquity or Earth’s axial tilt going from today’s 24.5 degrees to 22.1 degrees of the past (obliquity, 41,000-year cycles), and precession or direction of tilt (earth's wobble, 26,000-year cycles) going from today’s faint North Star to a brighter star Vega 13,000 years ago.
Our Changing Climate
As mentioned previously, we are currently in an interglacial interval coming out of the recent Wisconsin glacial period that dominated most of Canada, Northern Europe, and Northern Russia approximately 20,000 years ago. Whether we are still in the deglaciation cycle or about to begin a new glacial cycle is not known. How much CO2 has played in global warming in the geological past to the present can be seen by following the temperature and CO2 curves in the charts below. Contrary to popular belief, there is little correlation between CO2 and temperature except when the temperature rises, a CO2 increase follows. However controversial, it appears that the increased heat source is likely a change in solar irradiation and is the main driver of the heating and cooling on Earth, and that today's man-made CO2 contribution to global climate warming is minimal. NASA, on the other hand, disagrees, saying there has been a decoupling of solar irradiance and temperature since 1958 and that anthropogenic CO2 is currently driving climate warming. NASA agrees that higher CO2 levels are beneficial to plant growth and Earth's greening.
Interestingly, NOAA's Mauna Loa, Hawaii CO2 monitoring station officially began monitoring the rising CO2 levels in 1958. The year was significant and widely publicized as the International Geophysical Year (IGY), marking the beginning of international cooperation between two rival superpowers (US and USSR) studying and researching a wide range of geophysical topics, including solar output, Earth's climate, greenhouse gases, and the Antarctic. IGY occurred at the peak of a solar maximum cycle, Solar Cycle 19. This is also the year NASA, coincidentally, shows the start of their solar irradiance and temperature diversions. This is curious for two reasons. First, are the scientific and public disagreements and confusion over climate science based on a two-tiered science, one that is publicly hidden and debunked when it surfaces, and the other with alterations presented to the public? Second, did the IGY lay the foundation for the future commercial exploitation of some of their findings, such as increasing CO2 levels?
A couple of interesting studies, cited by Mason (2024), question whether current levels of CO2 in the atmosphere can further drive temperatures upwards. Mason summarizes the studies in the following statement, "the detailed dynamics of how, when and to what degree CO2 transforms radiation into atmospheric heat are anything but settled [IPCC, WEF, and UN say it is settled and we must trust the science]. So much remains unknown that recent academic research inquiring whether CO2 at its current atmospheric concentrations can even absorb more heat amounts to breaking new ground in climate science. If it can’t, notes Mason, then further changes in CO2 levels not only won’t drive “global boiling” [UN rhetoric], they won’t have any impact on climate at all."

Earth's climate, and its relationship to the sun, the solar system, and the cosmos, are complicated and dynamic and not well understood by mainstream science. It seems more likely that today's seasonal climate variations have been greatly exaggerated and confused by greedy exploitive capitalists and their political associates working and manipulating the science, technology, governmental policies, and social systems to their advantage, and fueled by media sensationalism and propaganda when in actuality these small and large seasonal climate cycles and fluctuations are completely natural. The United Nations (UN), Intergovernmental Panel on Climate Change (IPCC), and World Economic Forum (WEF) are the main proponents of man-made climate change and 'encourage' governments, organizations, media, and influential individuals to follow their distorted narrative and fascist ideological beliefs that do not favour or hinder the development of a viable sustainable, organic, holistic, self-sufficient, and enlighted future for all of humanity.

CO2 in PPMV vs. temperature for the past 570 million years. Source: Holoceneclimate.com

General graph of CO2 (PPM) concentrations over the past 60 million years. Possible future CO2 levels based on models. Source: Texas A&M Today

CO2 vs. temperature for the past 350,000 years. Source: Holoceneclimate.com

CO2 vs. temperature for the past 10,000 years. Source: Holoceneclimate.com


The Younger Dryas was a cold snap 12,750-11,750 years ago. No correlation between CO2 and Greenland ice core temperatures. Source: P. Gosselin (NoTricksZone)

Temperature and solar activity decoupled around 1958. Source: Global Climate Change (NASA)
Florides and Christodoulides (February 2009) in their article "Global Warming and Carbon Dioxide Through Sciences" concluded the following [square brackets added for clarity and inclusiveness]:
"Earth is a dynamic planet with a continuous variation of its climate. The present study [by Florides and Christodoulides] has indicated that in their turn the atmosphere, the lithosphere and the biosphere of the Earth change constantly through complex mechanisms affecting the climate. Many of these changes are unpredictable, enormous and sometimes sudden. It is certain that such natural climate-changes—both cooling and warming—will occur again and again in the future. Studying the climate record indicates that the 20th[and 21st]-century changes fall well within frequently seen past natural variations."
"It is our view that, there is not yet sufficient let alone rigorous evidence that anthropogenic CO2-increase is indeed the main factor contributing towards the global warming of the 20th[and 21st]-century. This conclusion is supported by a mere study of the inconsistent related literature, reinforced by our analysis on the (probably more reliable and thus far overlooked) chemical CO2-records, essentially showing that one cannot be positive for a relationship between temperaturedifference and CO2-concentration. On the contrary the conclusions using the adiabatic [when net heat flow is zero] theory show that global warming due to atmospheric CO2-increase is impossible. Our study also points that even when the presence of CO2- concentration in the atmosphere was at levels much higher than today, the temperature still considerably fluctuated. Regardless of CO2's role on global warming, CO2 is a key factor for biological activity that has generally benefited because of the increase observed in the last century"
How Important Is CO2 To Life On Earth?
There are numerous articles written on the advantages of higher CO2 concentrations on plant life and the environment. Here are some benefits:
Increase in rate of photosynthesis encourages growth and produces more oxygen and carbohydrates.
Reduces the amount of water lost through stomatal transpiration making plants more water efficient. According to NASA, the increased soil moisture in the long term decreases forest fires and droughts worldwide.
Stimulates growth of beneficial bacteria both in soil and water.
Reduces soil erosion by increasing plant cover. As stated by NASA, up to 50% of Earth's greening is due to higher CO2 levels.
Increases crop yields and food quantity.
Helps plants generate natural repellents to fight insect pests.
Plants grow faster and are less stressed.
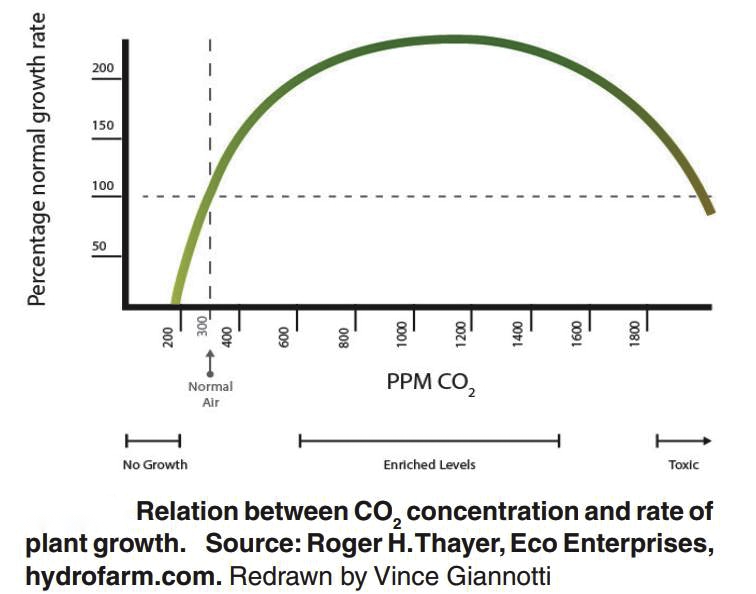
The CO2 threshold for plants is around 180 ppm, and lower concentrations will result in poor or no plant growth worldwide. From commercial greenhouse data, the optimal CO2 concentrations for plant growth are around 1000-1200 ppm, and concentrations beyond 1650 ppm are considered toxic. The current decarbonization projects around the world are a concern and can hinder the greening of this planet and prevent needed increased crop production. It appears these projects are more politically motivated and based on fanaticism rather than true science and should be discontinued at once.

CO2 fertilization effect on global gross primary production (GPP). Source: Haverd, Smith et al
The current normal air CO2 concentration is 424 ppm. Source: Oklahoma Cooperative Extension Services Source: NOAA Climate.gov

Source: NOAA Climate.gov

Temperatures for the past 66 million years. Source: Salt Lake Community College

Summer temperature anomalies based on tree ring proxies for the past 7000 years. Source: Salt Lake Community College

Composition of Earth's Atmosphere. Note that CO2 is only 0.0407% of the earth's atmospheric composition. Source: Salt Lake Community College
Sources:
- Ancient Deepsea Shells Reveal 66 Million Years of Carbon Dioxide Levels; Texas A&M Today; Texas A&M University; 2022; Ancient Deepsea Shells Reveal 66 Million Years Of Carbon Dioxide Levels - Texas A&M Today (tamu.edu); Site accessed 9/3/2023
- Barker, Stephen; et al; Distinct roles for precession, obliquity, and eccentricity in Pleistocene 100-kyr glacial cycles; Science; Vol 387, Issue 6737; February 28, 2025; Distinct roles for precession, obliquity, and eccentricity in Pleistocene 100-kyr glacial cycles | Science; Download preprint from Earth ArXiv, Distinct roles for precession, obliquity, and eccentricity in Pleistocene 100-kyr glacial cycles | Science; Sites accessed 03-02-2025.
Buis, Alan; Milankovitch (orbital) Cycles and Their Role In Earth's Climate; https://climate.nasa.gov/news/2948/milankovitch-orbital-cycles-and-their-role-in-earths-climate/; NASA's Jet Propulsion Laboratory; Feb 26, 2020
Campbell, J.M.; Peck, S.B.; Omalonomus Relictus, An Unusual New Genus and New Species) Coleoptera: Staphylinidae, Omaliinae) of Blind Rove Beetle; A Preglacial (Tertiary?) Relict In The Cypress Hills, Alberta-Saskatchewan, Canada; The Canadian Entomologist; Vol. 122; Pgs. 949-961; (PDF) Omalonomus relictus, an unusual new genus and new species (Coleoptera: Staphylinidae, Omaliinae) of blind rove beetle; a preglacial (Tertiary?) relict in the Cypress Hills, Alberta- Saskatchewan, Canada (researchgate.net); Sept/Oct 1990
Christiansen, E.A.; The Wisconsinan Deglaciation of Southwestern Saskatchewan and Adjacent Areas; https://cdnsciencepub.com/doi/pdf/10.1139/e79-079 ; Saskatchewan Research Council; Saskatoon; 1978
Climate4you; August 30, 2023; climate4you welcome; Site accessed 9/3/2023.
Climatism, Tracking Anthropogenic Climate Alarmism; https://climatism.blog/2018/11/29/before-mann-made-climate-change-chicago-was-buried-under-a-mile-of-ice/
Covert Geopolitics; Does the US Military “Own the Weather”? | Covert Geopolitics; Jan 23, 2020.
Davidson, Ben; Weatherman's Guide to the Sun, Third Edition; Space Weather News; Space Weather News; Colorado Springs, CO, 2020
Drilling in Antarctica to Find the Earth's Oldest Ice and 1.5 Million Years of Climate History; Merco Press, South Atlantic News Agency; Feb 10, 2023; Drilling in Antarctica to find the Earth's oldest ice and 1,5 million years of climate history — MercoPress; Site accessed 2/10/2023
Dyke, A. S., et al; Deglaciation of North America; https://geoscan.nrcan.gc.ca/starweb/geoscan/servlet.starweb?path=geoscan/downloade.web&search1=R=214399; Geological Survey of Canada; Open File 1574; Ottawa, ON; 2003
Dyke, Arthur S., Prest, Victor K.; Late Wisconsinan and Holocene Retreat of the Laurentide Ice Sheet; https://www.researchgate.net/publication/269875308_Late_Wisconsinan_and_Holocene_Retreat_of_the_Laurentide_Ice_Sheet_Geological_Survey_of_Canada_Map_1702A ; Geological Survey of Canada Map 1702A; Ottawa, ON; Jan 1987
Ebell, Myron; Milloy, Steven J; Wrong Again: 50 Years of Failed Eco-pocalyptic Predictions; Wrong Again: 50 Years of Failed Eco-pocalyptic Predictions - Competitive Enterprise Institute; September 18, 2019; Site accessed 12-12-2024.
Florides, Georgios A.; Christodoulides, Paul; Global Warming and Carbon Dioxide Through Sciences; Elsevier Environment International; Vol 35, Issue 2; February 2009; Pgs 390-401; Global warming and carbon dioxide through sciences (usp.br) or Global warming and carbon dioxide through sciences – ScienceDirect; Site accessed 8/28/2023.
Geology Cafe; Introduction to Geology-Chapter 12, Glaciers and Glaciation; https://geologycafe.com/class/chapter12.html
Gosselin, P; Younger Dryas Analysis: No Evidence At All CO2 Drives Temperature...Paper Used Sloppy Data Methods; No Tricks Zone; October 27, 2014; Younger Dryas Analysis: No Evidence At All CO2 Drives Temperature…Paper Used Sloppy Data Methods (notrickszone.com); Site accessed 9/5/2023.
Greenhouse Gas Concentrations; Environment and Climate Change Canada (ECCC); Government of Canada; June 6, 2023; Greenhouse gas concentrations – Canada.ca; Site accessed 8/31/2023.
Hassani, Naeem Javid Muhammad; The Benefits of Carbon Dioxide (CO2); Forestrypedia; 2023; The Benefits of Carbon Dioxide (CO2) – Forestrypedia; Site accessed 9/4/2023.
Haverd, Vanessa; Smith, Benjamin; et al; Higher Than Expected CO2 Fertilization Inferred From Leaf to Global Observations; Wiley Online Library; Global Change Biology; Vol 26, Issue 4; Pgs. 2390-2402; April 2020; Higher than expected CO2 fertilization inferred from leaf to global observations (wiley.com); Site accessed 9/4/2023.
Higgs, Roger; Proof That the Sun, Not CO2, Drives Earth's Climate; Geoclastica Ltd; Technical Note 2018-4; June 2018; (PDF) Proof that the sun, not CO2, drives Earth's climate (researchgate.net); Site accessed 8/31/2023.
Houghton, J. T.; et al, editors; Intergovernmental Panel on Climate Change; Climate Change 2001: The Scientific Basis; TAR-*A (ipcc.ch); Cambridge University Press; Cambridge, UK ; 2001
Humlum, Ole; Stordahl, Kjell; et al; The Phase Relation Between Atmospheric Carbon Dioxide and Global Temperature; Elsevier; Global and Planetary Change; Vol 100; January 2013; Pgs. 51-69; (PDF) The phase relation between atmospheric carbon dioxide and global temperature (researchgate.net) or The phase relation between atmospheric carbon dioxide and global temperature - ScienceDirect ; Site accessed 9/3/2023.
Inconvenient Facts Website; Gregory Wrightstone; 2017; Inconvenient Facts - Climate Change, #1 Amazon Best Seller; Site accessed 1-19-2026.
Johnson, Chris; Affolter, Matthew D.; et al; An Introduction to Geology-15 Global Climate Change; Salt Lake Community College; Salt Lake City, UT; 2017; 15 Global Climate Change – An Introduction to Geology (opengeology.org); Site accessed 8/31/3023
Keeling, Charles D; Piper, Stephen, C; et al; Atmospheric CO2 and 13CO2 Exchange with the Terrestrial Biosphere and Oceans from 1978 to 2000: Observations and Carbon Cycle Implications; Springer Nature Link; January 2005; Atmospheric CO2 and 13CO2 Exchange with the Terrestrial Biosphere and Oceans from 1978 to 2000: Observations and Carbon Cycle Implications | SpringerLink also, (PDF) Atmospheric CO2 and 13CO2 Exchange with the Terrestrial Biosphere and Oceans from 1978 to 2000: Observations and Carbon Cycle Implications; Site accessed 11-05-2024.
Klampe, Michelle; Six-million-year-old ice discovered in Antarctica offers unprecedented window into a warmer Earth; Phys.org; October 28, 2025; Six-million-year-old ice discovered in Antarctica offers unprecedented window into a warmer Earth; Site accessed 11/10/2025.
Klassen, R.W.; Surficial Geology of the Cypress Lake and Wood Mountain Map Areas, Southwestern Saskatchewan; http://www.publications.gc.ca/site/eng/108901/publication.html; Geological Survey of Canada; Ottawa; Bulletin 562; 2002
Lerbekmo, J.F, Rutter, Nat; Geology of the Alberta Cypress Hills, including the Eagle Butte Impact Structure; http://www.egs.ab.ca/Resources/FieldGuides/2000_Cypress_Hills.pdf; Edmonton Geological Society; Edmonton; Sept 29-Oct1, 2000
Mason, Jim; A Planet That Might Not Need Saving: Can CO2 Even Drive Global Temperatures; C2C Journal; A Planet that Might Not Need Saving: Can CO2 Even Drive Global Temperature? | C2C Journal; October 13, 2024; Site accessed 12-12-2024.
McIntyre, Stephen; McKitrick, Ross; Hockey sticks, principal components, and spurious significance; Geophysical Research Letters; Vol 32; Issue 3; L03710; February 12, 2005; Hockey sticks, principal components, and spurious significance; or Hockey sticks, principal components, and spurious significance - McIntyre - 2005 - Geophysical Research Letters - Wiley Online Library; Site accessed 1-19-2026.
NASA Global Climate Change; Carbon Dioxide; July 2023; Carbon Dioxide | Vital Signs – Climate Change: Vital Signs of the Planet (nasa.gov); Site accessed 8/31/2023.
NASA Global Climate Change; There Is No Impending 'Mini Ice Age'; February 13, 2020; There Is No Impending 'Mini Ice Age' – Climate Change: Vital Signs of the Planet (nasa.gov); Site accessed 9/5/2023.
NASA Global Climate Change; What Is the Sun's Role in Climate Change?; September 6, 2019; What Is the Sun's Role in Climate Change? – Climate Change: Vital Signs of the Planet (nasa.gov); Site accessed 8/31/2023.
NOAA Climate, US Government; Climate Change: Atmospheric Carbon Dioxide; May 12, 2023; Climate Change: Atmospheric Carbon Dioxide | NOAA Climate.gov; Site accessed 9/5/2023.
NOAA Climate, US Government; Ice Sheet Extent Near the Peak of the Last Ice Age; February 18, 2021; Figure1_NP_SOS_GlacialMax_1x1_map_large.jpg | NOAA Climate.gov; Site accessed 9/5/2023.
NOAA Global Monitoring Laboratory-Trends in Atmospheric Carbon Dioxide-Monthly Average Mauna Loa CO2; Global Monitoring Laboratory - Carbon Cycle Greenhouse Gases (noaa.gov); Site accessed 8/28/2023
Pedro, J. B.; Rasmussen, S. O.; et al; Tightened Constraints On the Time-lag Between Antarctic Temperatures and CO2 During the Last Deglaciation; European Geoscience Union; Vol 8, Issue 4; Pgs. 1213-1221; July 23, 2012; cp-8-1213-2012.pdf (copernicus.org); Site accessed 8/31/2023.
Poudel, Megha; Dunn, Bruce; Greenhouse Carbon Dioxide Supplementation; Oklahoma State Univerity; Oklahoma Cooperative Extension Services HLA-6723; March 2017; greenhouse-carbon-dioxide-supplementation-hla-6723.pdf (okstate.edu); Site accessed 9/4/2023.
Rae, James W.B.; Zhang, Yi Ge; et al; Atmospheric CO2 Over The Past 66 Million Years From Marine Archives; Annual Review of Earth and Planetary Sciences; Vol 49; 2021; Pgs. 609-641; Atmospheric CO2 over the Past 66 Million Years from Marine Archives (annualreviews.org); Site accessed on 9/3/2023.
Sauchyn, David, editor; Quaternary and Late Tertiary Landscapes of Southwestern Saskatchewan and Adjacent Areas; Canadian Plains Research Center; (No URL) University of Regina; Regina, SK; 1993
Sauchyn, David; What Does Climate Change Look Like In Saskatchewan?; YouTube Video; https://youtu.be/pxFU3LrvcSI?si=qP6G51duhKE5BwTZ; May 30, 2012; Site accessed 11-05-2024.
Shackleton, S.; Hishamunda, V.; et al; Miocene and Pliocene ice and air from the Allan Hills blue ice area, East Antarctic; PNAS; October 28, 2025; Miocene and Pliocene ice and air from the Allan Hills blue ice area, East Antarctica | PNAS; Site accessed 11-10-2025.
Sternberg, Rob; The IGY and Me-Science, History, Culture, Philately and Memorabilia of the International Geophysical Year (1957-58); March 5, 2022; The IGY and Me: IGY Bulletin, Number 8, February 1958 - A report on the United States Program (internationalgeophysicalyear.blogspot.com); Site accessed 9/5/2023.
Temperature Versus CO2-The Big Picture; Holoceneclimate.com; 2018; Temperature versus CO2 – the big picture | Holoceneclimate.com; Site accessed 8/31/2023.
Trends in Atmospheric Carbon Dioxide; NOAA Global Monitoring Laboratory; US Government; Global Monitoring Laboratory - Carbon Cycle Greenhouse Gases (noaa.gov); Site accessed 8/31/2023.
University of California, Santa Barbara; Scientists match Earth’s ice ages cycles with orbital shifts; Phys.org; February 27, 2025; Scientists match Earth's ice age cycles with orbital shifts; Site accessed 03-02-2025.
Wikipedia; Milankovitch Cycles; Edited February 12, 2025; Milankovitch cycles – Wikipedia; Site accessed 03-21-2025.
Wikipedia; Modern Maximum; August 18, 2023; Modern Maximum – Wikipedia; Site accessed 9/7/2023.
Wikipedia; Solar Cycle 19; August 16, 2022; Solar cycle 19 – Wikipedia; Site accessed 9/7/2023
Wrightstone, Gregory; Inconvenient Facts; Silver Crown Productions, LLC; USA; Fifth Printing; October 2019.
Youtube: Inconvenient Facts; Unusual and Unprecedented Warming-Presentation to the AAPG ACE 2020; October 29, 2020; Unusual and Unprecedented Warming - Presentation to the AAPG ACE 2020; Site accessed 1-19-2026.
Youtube: Michael Moore; Michael Moore Presents: Planet of the Humans | A Film by Jeff Gibbs | Full Documentary; April 21, 2020; Michael Moore Presents: Planet of the Humans | A Film by Jeff Gibbs | Full Documentary; Site accessed 1-19-2026.
 Deep
crevasse
on a
rigid
glacial surface.
Image: Simon Steinberger from Pixabay.com.
Deep
crevasse
on a
rigid
glacial surface.
Image: Simon Steinberger from Pixabay.com. Frenchman
River Valley. A broad
deep glacial meltwater
channel occupied by the
'underfit' Frenchman River in
the
foreground.
The white band is the
Whitemud Formation (~67
Ma). Photo: Charles
Kuss
Frenchman
River Valley. A broad
deep glacial meltwater
channel occupied by the
'underfit' Frenchman River in
the
foreground.
The white band is the
Whitemud Formation (~67
Ma). Photo: Charles
Kuss |
 A
post glacial feature formed in a proglacial outwash plain. A sand
dune in the Great Sand Hills, 18km east of Liebenthal, SK, east on
Twp 200. Photo: Charles Kuss
A
post glacial feature formed in a proglacial outwash plain. A sand
dune in the Great Sand Hills, 18km east of Liebenthal, SK, east on
Twp 200. Photo: Charles Kuss Glacial
features on a glacial claystone erratic, Hatton, SK cemetery, approx
9 km north of HWY 1 on gravel road 635. Notice the shallow
longitudinal striations (grooves and scratches) caused by debris
frozen in ice as it moved over the erratic. This claystone erratic
is not a Canadian Shield rock and may have originated from a nearby
regional subcrop. Photo: Charles Kuss
Glacial
features on a glacial claystone erratic, Hatton, SK cemetery, approx
9 km north of HWY 1 on gravel road 635. Notice the shallow
longitudinal striations (grooves and scratches) caused by debris
frozen in ice as it moved over the erratic. This claystone erratic
is not a Canadian Shield rock and may have originated from a nearby
regional subcrop. Photo: Charles Kuss
